Free Access
Fig. 2
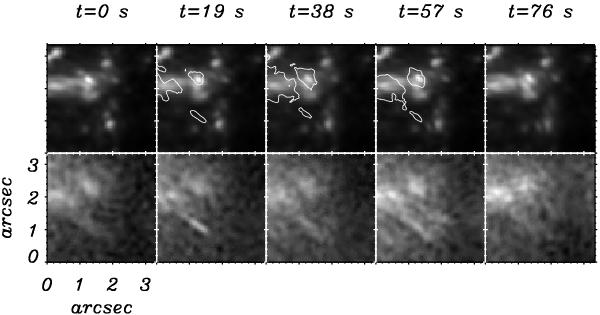
Upper row: time series of G-continuum images; lower row: cotemporal and cospatial images in the Ca ii H line core showing temporal evolution of a jet event located close to penumbral filaments. The location of this event is marked by the almond colored circle at  and
and  in the right panel of Fig. 1.
Current usage metrics show cumulative count of Article Views (full-text article views including HTML views, PDF and ePub downloads, according to the available data) and Abstracts Views on Vision4Press platform.
Data correspond to usage on the plateform after 2015. The current usage metrics is available 48-96 hours after online publication and is updated daily on week days.
Initial download of the metrics may take a while.