Fig. 1
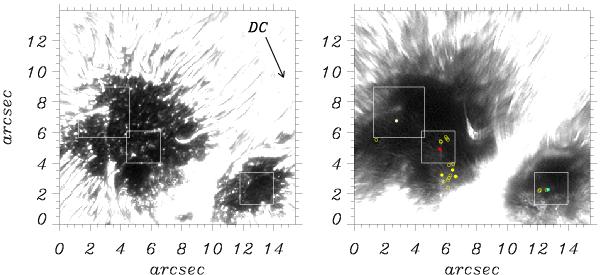
Left panel: observed sunspot imaged in G-continuum. The gray-scale has been chosen to better show umbral features. The direction toward disk center is indicated by the arrow labeled “DC” at the upper right corner; right panel: simultaneous and cospatial Ca ii H line core image of the same sunspot. The gray-scale is chosen to enhance fine structures in the umbral chromosphere. Circles show the locations of all jet-like events identified in the time series. Circles filled in different colors mark the locations of events discussed in the main text. White boxes show the fields-of-view of events discussed in the text and shown in Figs. 2–4 (from left to right). The temporal evolution is shown in a movie available in the on-line edition. The movie uses a slightly different gray-scale to highlight the features.
Current usage metrics show cumulative count of Article Views (full-text article views including HTML views, PDF and ePub downloads, according to the available data) and Abstracts Views on Vision4Press platform.
Data correspond to usage on the plateform after 2015. The current usage metrics is available 48-96 hours after online publication and is updated daily on week days.
Initial download of the metrics may take a while.