Fig. 7
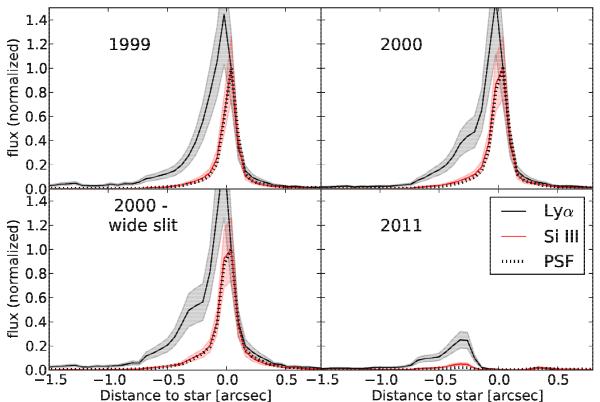
Spatial profile on the red (250 to 450 km s-1) side of the Lyα line, the Si iii line, and of a continuum region. All line profiles and continuum profiles are normalized (see text for details). Shaded regions indicate the statistical uncertainty for the lines. The uncertainty on the continuum profile is negligible because it is extracted from a much larger region.
Current usage metrics show cumulative count of Article Views (full-text article views including HTML views, PDF and ePub downloads, according to the available data) and Abstracts Views on Vision4Press platform.
Data correspond to usage on the plateform after 2015. The current usage metrics is available 48-96 hours after online publication and is updated daily on week days.
Initial download of the metrics may take a while.