Fig. 6
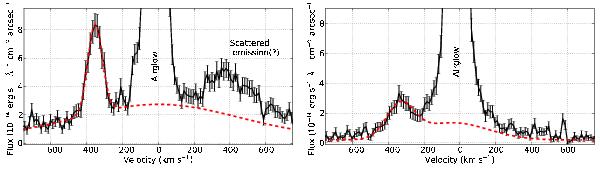
Spectra of the Lyα line in the two brightest knots. The inner part of the line is contaminated by airglow. Additionally, the knot closer to the source (left panel) shows some emission on the red side of the line which could be due to scattered light from the central star (see text). We fit two Gaussians for knot and background (dashed line). Both knots appear blue-shifted by about 350 km s-1.
Current usage metrics show cumulative count of Article Views (full-text article views including HTML views, PDF and ePub downloads, according to the available data) and Abstracts Views on Vision4Press platform.
Data correspond to usage on the plateform after 2015. The current usage metrics is available 48-96 hours after online publication and is updated daily on week days.
Initial download of the metrics may take a while.