Fig. 5
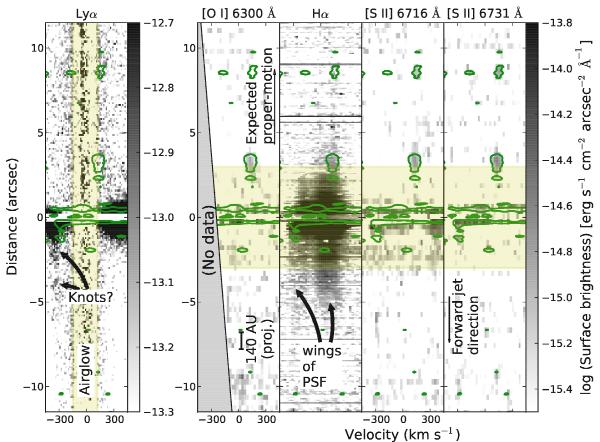
PVD for Lyα, Hα and three optical FELs. For comparison, the contour lines for [S ii] 6731 Å are overlaid in all panels. Left: the Lyα line is contaminated by airglow close to the rest velocity. Right: the optical lines show scattered light close to the central star despite the occulting bar. These areas are shaded. [O i] 6300 Å is located close to the edge of the chip, so no data exists in the bottom left of the PVD. Contour lines are drawn for [S ii] 6731 Å at the level 7 × 10-16 erg s-1 Å-1 cm-2 arcsec-2. The optical PVDs are background-subtracted (see text). The following wavelength intervals are used to fit the background: [O i] 6300 Å: 6352–6357 Å, and 6376–6382 Å; Hα: 6504–6524 Å, and 6604–6624 Å; [S ii] 6716 Å: 6705–6708 Å, and 6721–6724 Å; [S ii] 6731 Å: 6721–6723 Å, and 6735–6738 Å. (This figure is available in color in electronic form.)
Current usage metrics show cumulative count of Article Views (full-text article views including HTML views, PDF and ePub downloads, according to the available data) and Abstracts Views on Vision4Press platform.
Data correspond to usage on the plateform after 2015. The current usage metrics is available 48-96 hours after online publication and is updated daily on week days.
Initial download of the metrics may take a while.