Fig. 3
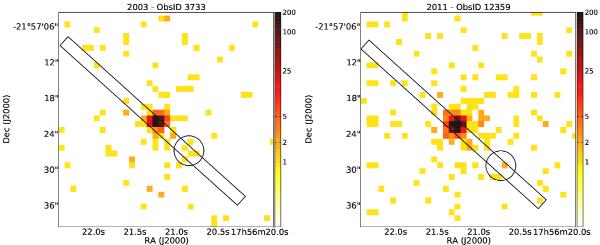
Chandra/ACIS image of HD 163296 and its jet HH 409 in the energy range 0.2–5.0 keV binned up by a factor of two (Each block is 2 pixel ≈1′′ on the side). The black box shows the position of the optical jet. The half-width of the box is comparable to the PSF (1′′). The long axis of the box passes through the centroid of the X-ray emission and has the position angle 42°. Circles indicate locations of possible emission knots. The radii are 2.5′′. (This figure is available in color in electronic form.)
Current usage metrics show cumulative count of Article Views (full-text article views including HTML views, PDF and ePub downloads, according to the available data) and Abstracts Views on Vision4Press platform.
Data correspond to usage on the plateform after 2015. The current usage metrics is available 48-96 hours after online publication and is updated daily on week days.
Initial download of the metrics may take a while.