Fig. 5
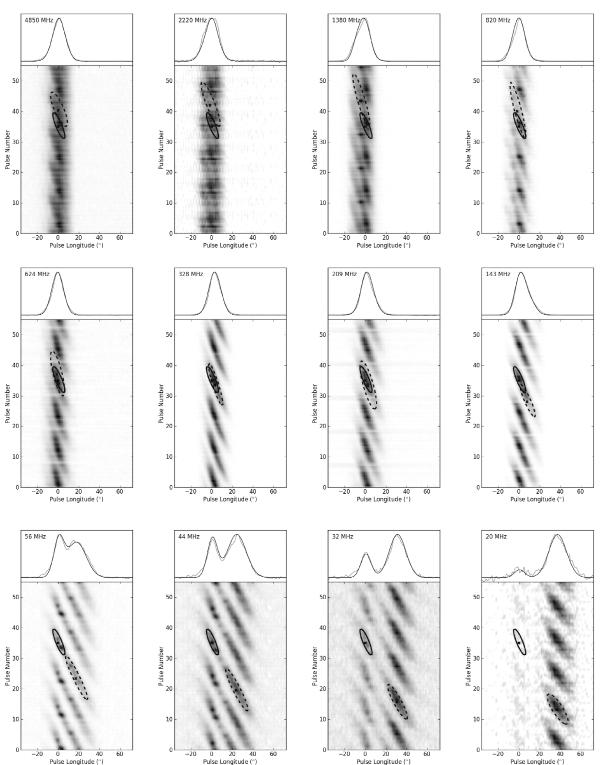
Folded “pulse stacks” from each of the observations used. The solid and dashed ellipses show the half power points of 2D Gaussians fitted to the data using a least squares method. The central observing frequency of each panel is indicated in the top left corner. The driftbands are repeated over 5 × P3 so that the full drift pattern is visible at all frequencies. The pulse profile (grey line), and a simulated pulse profile (black line) from each 2D fit is shown in the panel above the corresponding pulse stack.
Current usage metrics show cumulative count of Article Views (full-text article views including HTML views, PDF and ePub downloads, according to the available data) and Abstracts Views on Vision4Press platform.
Data correspond to usage on the plateform after 2015. The current usage metrics is available 48-96 hours after online publication and is updated daily on week days.
Initial download of the metrics may take a while.