Free Access
Fig. 1
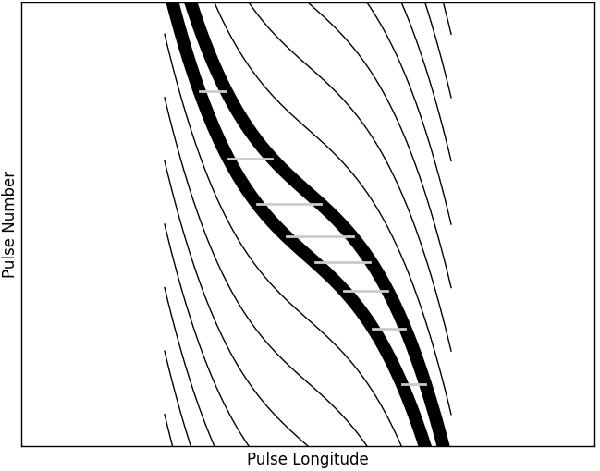
Illustration of how curved driftbands mean that P2 varies with pulse longitude. The black lines represent the shape of simulated driftbands. The grey lines represent the size of P2 for the highlighted driftbands. One can see that P2 varies significantly depending on the gradient of the driftbands at a given pulse longitude.
Current usage metrics show cumulative count of Article Views (full-text article views including HTML views, PDF and ePub downloads, according to the available data) and Abstracts Views on Vision4Press platform.
Data correspond to usage on the plateform after 2015. The current usage metrics is available 48-96 hours after online publication and is updated daily on week days.
Initial download of the metrics may take a while.