Free Access
Fig. 3
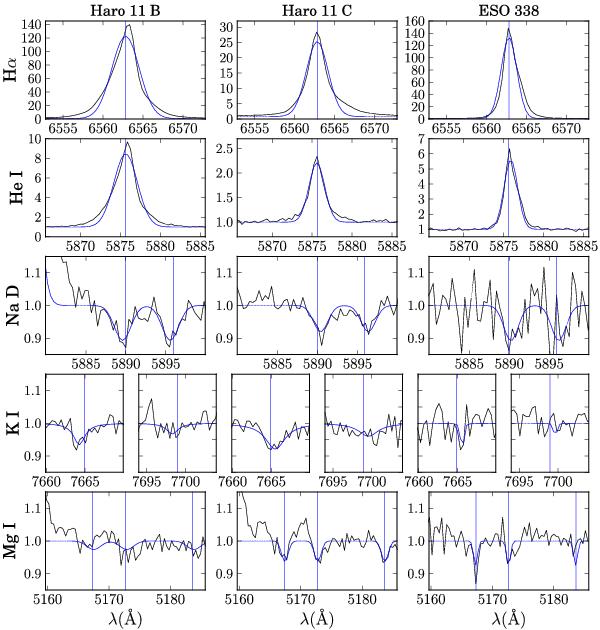
Hα, He i (5875.6), Na D, K i and Mg i line profiles from the VLT/X-shooter data. The blue Gaussians are a simple fit to the emission or absorption lines. The vertical lines show the systemic velocity as given by the Hα Gaussian fit. The y-axis is normalized to the continuum.
Current usage metrics show cumulative count of Article Views (full-text article views including HTML views, PDF and ePub downloads, according to the available data) and Abstracts Views on Vision4Press platform.
Data correspond to usage on the plateform after 2015. The current usage metrics is available 48-96 hours after online publication and is updated daily on week days.
Initial download of the metrics may take a while.