Fig. 2
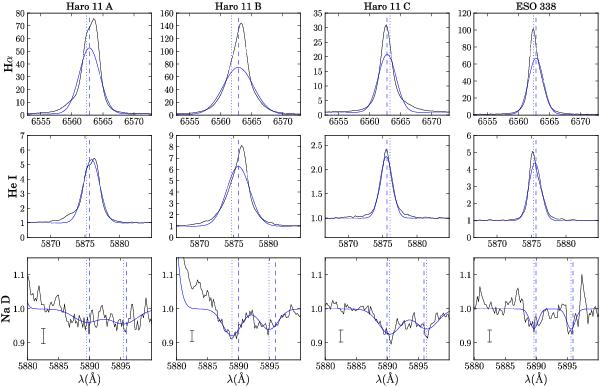
Hα, He i (5875.6) and Na D line profiles from the VLT/FLAMES data. The blue Gaussians are a simple fit to the emission or absorption lines. In the case of Haro 11 knot A, the best fit is shown in this figure but is never used. The vertical dashed lines show the velocity given by the Hα Gaussian fit, and the vertical dotted lines show the Na D velocity. The y-axis is normalized to the continuum. Also shown inset in the bottom row are errorbars, representing the standard deviation in the continuum from 5900 to 5950 Å, which shows no emission or absorption features. Since the spectra are normalized to the continuum, these errorbars reflect the strength of the continuum in each region.
Current usage metrics show cumulative count of Article Views (full-text article views including HTML views, PDF and ePub downloads, according to the available data) and Abstracts Views on Vision4Press platform.
Data correspond to usage on the plateform after 2015. The current usage metrics is available 48-96 hours after online publication and is updated daily on week days.
Initial download of the metrics may take a while.