Fig. 6
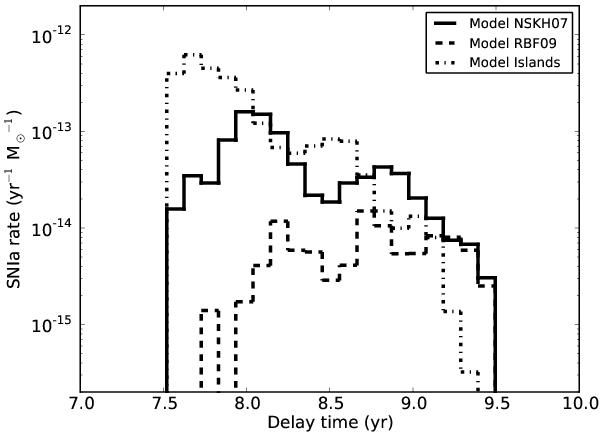
Delay time distribution assuming the γ-algorithm for the CE with γ = 1.75. Different lines correspond to the delay time distributions that result from four different approaches described in Sect. 3, all for the γ-prescription. The dot-dashed line shows the result of the Islands selection method, the three other linestyles correspond to the retention efficiencies as in Fig. 3. Note that for the retention efficiency of Y10 no SD binaries evolve into a SNeIa.
Current usage metrics show cumulative count of Article Views (full-text article views including HTML views, PDF and ePub downloads, according to the available data) and Abstracts Views on Vision4Press platform.
Data correspond to usage on the plateform after 2015. The current usage metrics is available 48-96 hours after online publication and is updated daily on week days.
Initial download of the metrics may take a while.