Fig. 3
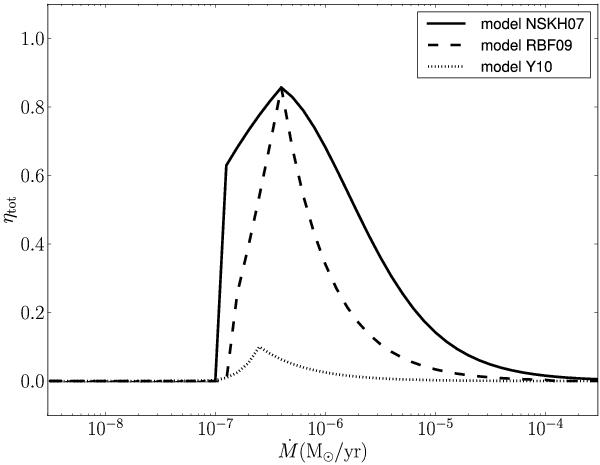
Total retention efficiencies, resulting from different combinations of the hydrogen and helium retention efficiencies. In this figure we have assumed MWD = 1 M⊙ as an example. The mass transfer rate Ṁ = | Ṁcomp |. For lower (higher) MWD the maximum retention efficiency shift to lower (higher) | Ṁcomp |. For a more detailed explanation of the retention efficiencies see Sect. 3.1.
Current usage metrics show cumulative count of Article Views (full-text article views including HTML views, PDF and ePub downloads, according to the available data) and Abstracts Views on Vision4Press platform.
Data correspond to usage on the plateform after 2015. The current usage metrics is available 48-96 hours after online publication and is updated daily on week days.
Initial download of the metrics may take a while.