Fig. 5
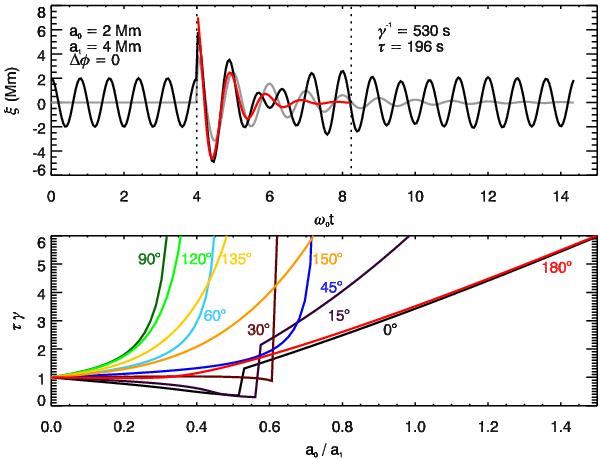
Top: example displacement ξ(t) using Eq. (6) as a function of time, which satisfies condition (7). The amplitudes are a0 = 2 Mm and a1 = 4 Mm. The two oscillations are in phase. The grey curve shows the impulsive part. The red line is the fitted damped oscillation (1). Bottom: τγ as a function of the ratio of amplitudes a0/a1 for different phase differences between the two solutions in Eq. (6). Here a0 represents the full amplitude of the driven oscillation (including the square-root denominator). We assumed ω0 = 2π/250 rad s-1, ω = 2π/200 rad s-1, γ = 1/530 Hz.
Current usage metrics show cumulative count of Article Views (full-text article views including HTML views, PDF and ePub downloads, according to the available data) and Abstracts Views on Vision4Press platform.
Data correspond to usage on the plateform after 2015. The current usage metrics is available 48-96 hours after online publication and is updated daily on week days.
Initial download of the metrics may take a while.