Fig. 4
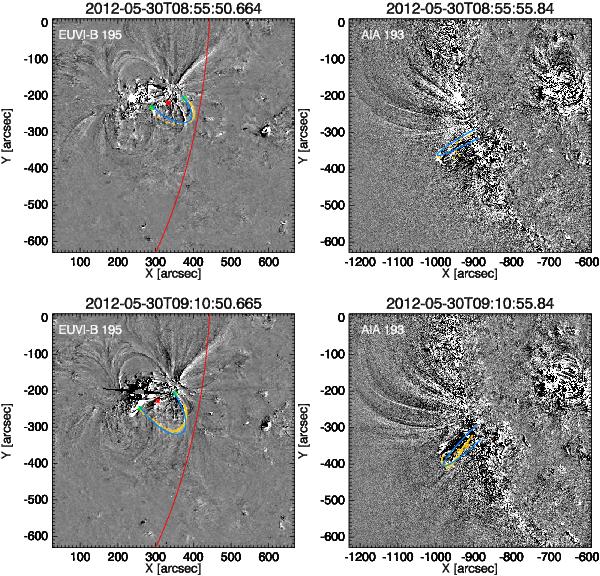
Three-dimensional reconstruction of two distinct loops before (top) and after (bottom) the flare, projected on the EUVI-B (left) and AIA (right) view. We plotted the centre of the loop (red point) on the solar surface, and the footpoints (green points) on the respective sides. The red line in STEREO-B images represents the limb as seen from SDO. The points obtained from the scc_measure.pro are plotted as yellow dots and the loop profile is given by a blue line. The movie available on-line shows the temporal evolution of the loops.
Current usage metrics show cumulative count of Article Views (full-text article views including HTML views, PDF and ePub downloads, according to the available data) and Abstracts Views on Vision4Press platform.
Data correspond to usage on the plateform after 2015. The current usage metrics is available 48-96 hours after online publication and is updated daily on week days.
Initial download of the metrics may take a while.