Fig. 3
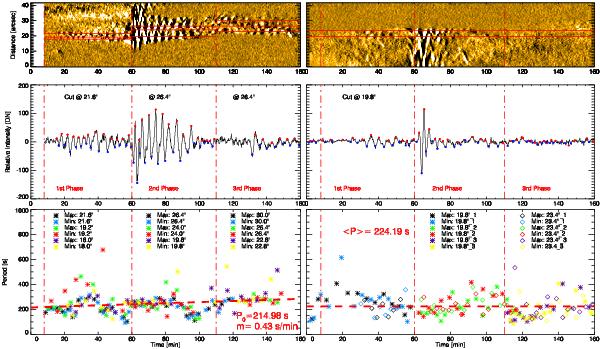
Top: time-distance maps for the moving (left panel) and steady (right panel) slit (red lines in Fig. 1c). The time distance map of the top left panel is included in the on-line movie; it shows the loop evolution. Middle: zoomed parts of the time-distance maps: the red and blue bullets are the maxima and minima positions. Bottom: period vs. time as inferred from the intensity profiles above (red lines in the time-distance maps). The vertical dot-dashed lines show the different oscillation regimes. The dashed line shows the linear trend in the period, with the initial value about 214 s and the increment of 0.43 s/min (left panel), and the average period of 224.19 s (right panel).
Current usage metrics show cumulative count of Article Views (full-text article views including HTML views, PDF and ePub downloads, according to the available data) and Abstracts Views on Vision4Press platform.
Data correspond to usage on the plateform after 2015. The current usage metrics is available 48-96 hours after online publication and is updated daily on week days.
Initial download of the metrics may take a while.