Fig. 1
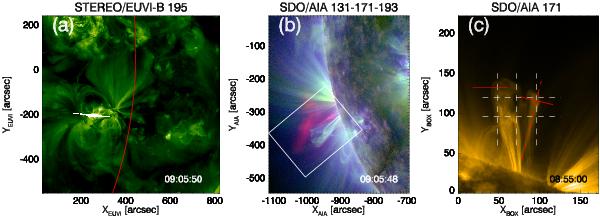
a) Image of the AR NOAA 11494 and the flare from STEREO/EUVI-B at 195 Å: the red line marks the position of the solar limb as seen from SDO (or Earth). b) RGB (red, green, blue) image of 131, 171, and 193 Å snapshots from SDO at the time of the flare: the release of the plasma bubble after the flare is visible in the red (131) channel. c) Adaptation of the white rectangle in b) at 171 Å showing the loop system with the overplotted slits (white and red continuous lines). The movie available on-line shows the temporal evolution of the RGB image of the white rectangle in panel b) and the time evolution of panel c). The movie also contains the time-distance maps shown in Fig. 3.
Current usage metrics show cumulative count of Article Views (full-text article views including HTML views, PDF and ePub downloads, according to the available data) and Abstracts Views on Vision4Press platform.
Data correspond to usage on the plateform after 2015. The current usage metrics is available 48-96 hours after online publication and is updated daily on week days.
Initial download of the metrics may take a while.