Fig. 8
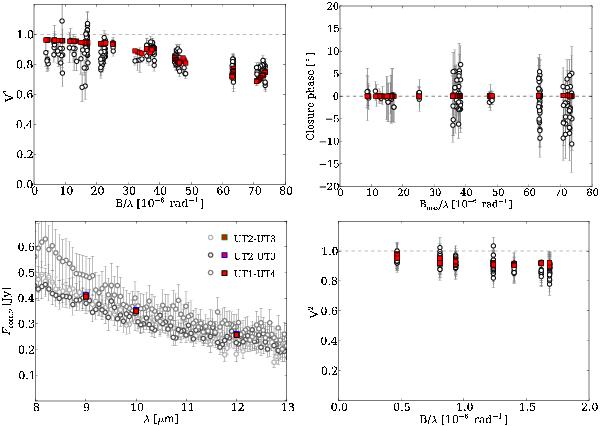
Upper left: observed and modeled PIONIER V2 (black circles, red squares, respectively) for the best-fit MCFOST model. Upper right: same for PIONIER closure phases. Bottom left: observed MIDI correlated fluxes (grey circles) and modeled correlated fluxes at 9, 10, and 12 μm (red squares). Bottom right: observed and modeled SAM V2 (black circles, red squares, respectively).
Current usage metrics show cumulative count of Article Views (full-text article views including HTML views, PDF and ePub downloads, according to the available data) and Abstracts Views on Vision4Press platform.
Data correspond to usage on the plateform after 2015. The current usage metrics is available 48-96 hours after online publication and is updated daily on week days.
Initial download of the metrics may take a while.