Free Access
Fig. 2
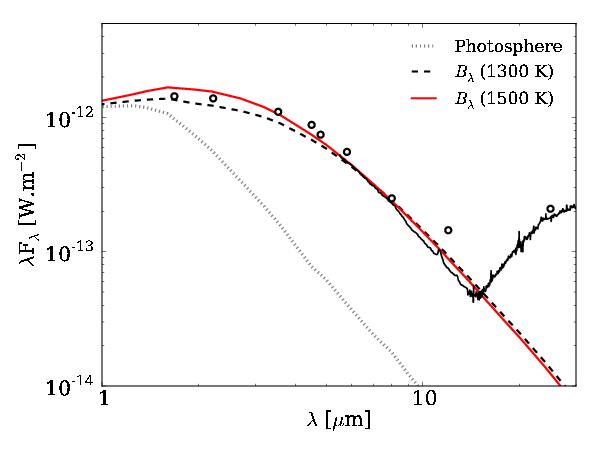
Blow-up of the SED of T Cha in the near-, mid-IR. Stellar photosphere is shown in dotted grey. Two Planck functions at different temperatures (T = 1300 and 1500 K) are shown in dashed black and solid red, respectively. Both Planck functions are scaled to the IRS flux at 6 μm.
Current usage metrics show cumulative count of Article Views (full-text article views including HTML views, PDF and ePub downloads, according to the available data) and Abstracts Views on Vision4Press platform.
Data correspond to usage on the plateform after 2015. The current usage metrics is available 48-96 hours after online publication and is updated daily on week days.
Initial download of the metrics may take a while.