Free Access
Fig. 10
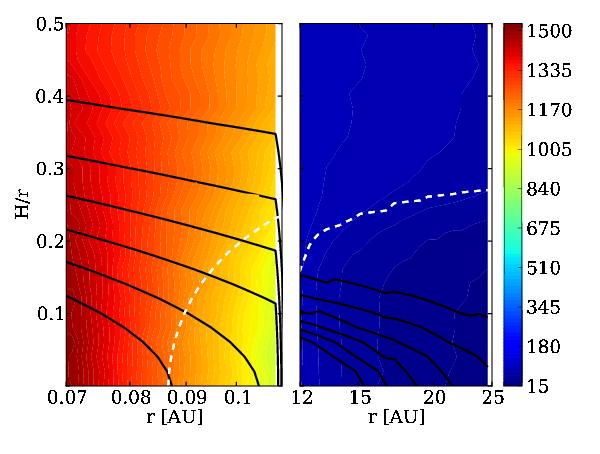
Temperature maps for the inner and outer disks (left and right, respectively). The dark contours represent [0.6, 0.5, 0.4, 0.3, 0.2, 0.1] times the maximum density, and the white dashed line represent where the integrated radial optical depth equals 1.
Current usage metrics show cumulative count of Article Views (full-text article views including HTML views, PDF and ePub downloads, according to the available data) and Abstracts Views on Vision4Press platform.
Data correspond to usage on the plateform after 2015. The current usage metrics is available 48-96 hours after online publication and is updated daily on week days.
Initial download of the metrics may take a while.