Fig. 1
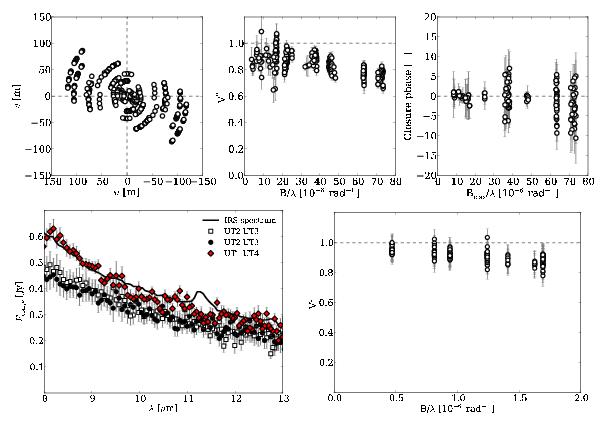
Top row: from left to right: coverage of the (u,v) plan, squared visibilities V2 and closure phase for the PIONIER observations. Bottom left panel: correlated fluxes for the three MIDI observations and the IRS spectrum. Filled red diamonds (baseline UT1–UT4) have been discarded from the analysis (see text for details). Bottom right panel: NaCo/SAM squared visibilities as a function of spatial frequency.
Current usage metrics show cumulative count of Article Views (full-text article views including HTML views, PDF and ePub downloads, according to the available data) and Abstracts Views on Vision4Press platform.
Data correspond to usage on the plateform after 2015. The current usage metrics is available 48-96 hours after online publication and is updated daily on week days.
Initial download of the metrics may take a while.