Fig. 9
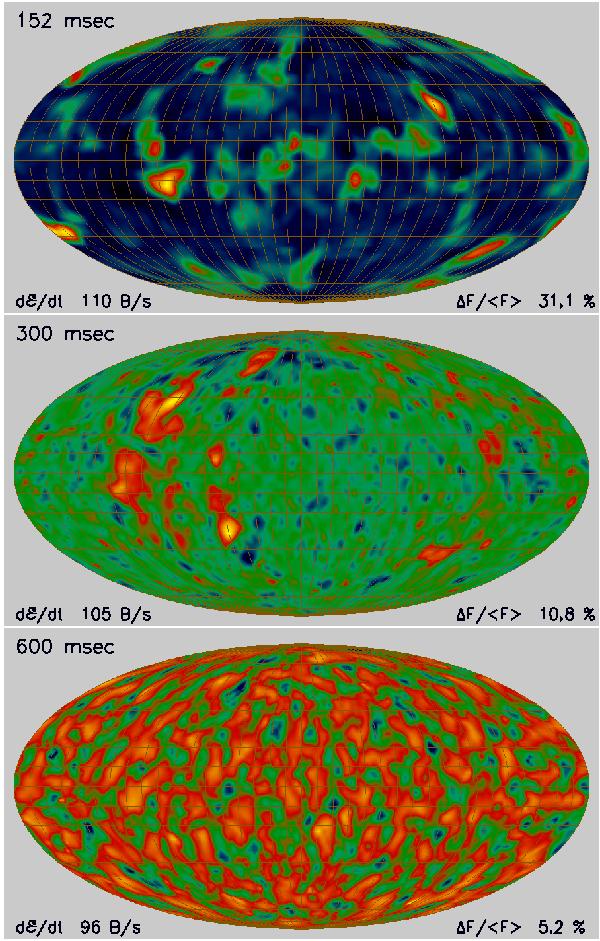
Neutrino flux asymmetry at ~150, 300, 600 ms after bounce for model W15-3 as
representative case. The 4π-maps show the relative variations
ΔF/ ⟨ F ⟩ in the total (i.e., sum for
ν and  of all three neutrino flavors) neutrino energy flux in all directions. Hot spots
(yellow and red) during the postbounce accretion phase (t ≲ 400 ms;
top and middle panels) are connected to strong convective
downflows in the neutrino-heated postshock layer. The typical scale of the
corresponding high-emission areas is 20–30 degrees, and the amplitude of variations
ranges around 10–30% during most of the time, though rare, single maxima can reach
up to ~70%. After the accretion has ended
(t ~ 400–500 ms), the flux variation pattern is determined by
the cell structure of the convection inside the proto-neutron star (i.e., below the
neutrinosphere) and the variation amplitute decreases to a few percent
(bottom panel). The number in the lower left corner of the plots
(dℰ/dt) gives the total neutrino energy loss rate as flux
integral over the whole emitting surface.
of all three neutrino flavors) neutrino energy flux in all directions. Hot spots
(yellow and red) during the postbounce accretion phase (t ≲ 400 ms;
top and middle panels) are connected to strong convective
downflows in the neutrino-heated postshock layer. The typical scale of the
corresponding high-emission areas is 20–30 degrees, and the amplitude of variations
ranges around 10–30% during most of the time, though rare, single maxima can reach
up to ~70%. After the accretion has ended
(t ~ 400–500 ms), the flux variation pattern is determined by
the cell structure of the convection inside the proto-neutron star (i.e., below the
neutrinosphere) and the variation amplitute decreases to a few percent
(bottom panel). The number in the lower left corner of the plots
(dℰ/dt) gives the total neutrino energy loss rate as flux
integral over the whole emitting surface.
Current usage metrics show cumulative count of Article Views (full-text article views including HTML views, PDF and ePub downloads, according to the available data) and Abstracts Views on Vision4Press platform.
Data correspond to usage on the plateform after 2015. The current usage metrics is available 48-96 hours after online publication and is updated daily on week days.
Initial download of the metrics may take a while.