Fig. 8
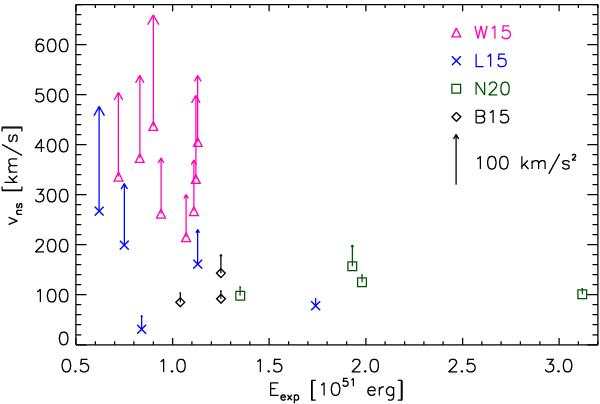
NS kick velocities and acceleration values (indicated by the length of the arrows attached to the symbols) versus explosion energies for all computed models after 1.1–1.4 s of simulated postbounce evolution. Models corresponding to different progenitors are shown by different symbols as defined in the figure.
Current usage metrics show cumulative count of Article Views (full-text article views including HTML views, PDF and ePub downloads, according to the available data) and Abstracts Views on Vision4Press platform.
Data correspond to usage on the plateform after 2015. The current usage metrics is available 48-96 hours after online publication and is updated daily on week days.
Initial download of the metrics may take a while.