Fig. 7
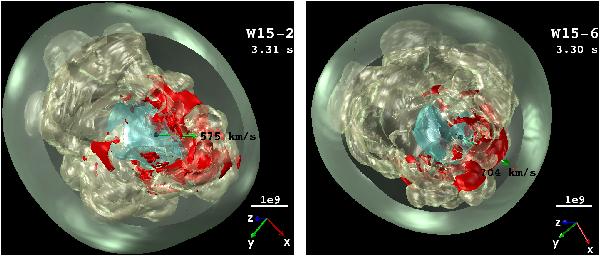
Ejecta morphology of the high-kick models W15-2 (left) and W15-6 (right) at approximately 3.3 s after bounce. The NS (indicated by black spheres, enlarged by a factor of 20 for better visibility) are accelerated by the gravitational tug of the asymmetrically distributed, dense ejecta to velocities of 575 km s-1 and 704 km s-1, respectively (green arrows pointing to the right). The ejecta “clumps” with the highest densities, which are mainly responsible for the gravitational attraction, are visualized by the red-colored surfaces of constant density of 104 g cm-3. The small black dot left of the NS in both images marks the coordinate origin. The NS displacement relative to this location was computed by time integration of the NS velocity. After ~3.3 s it is only 1260 km in W15-2 and 1440 km in W15-6. The neutrino-heated, asymmetrically distributed inner ejecta are bounded by the semi-transparent, beige surface from outside and the semi-transparent, light blue surface from inside. The former surface is defined by a constant 56Ni mass fraction of 5%, the latter surface conincides with the termination shock of the neutrino-driven wind. The outermost, semi-transparent green surface (cut open towards the observer for better visibility of the inner volume) corresponds to the SN shock wave. The average shock radius is approximately 36 000 km at the displayed time. A yardstick of 10 000 km along with a tripod indicating the coordinate directions are provided in the lower right corner of each plot.
Current usage metrics show cumulative count of Article Views (full-text article views including HTML views, PDF and ePub downloads, according to the available data) and Abstracts Views on Vision4Press platform.
Data correspond to usage on the plateform after 2015. The current usage metrics is available 48-96 hours after online publication and is updated daily on week days.
Initial download of the metrics may take a while.