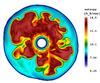
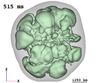
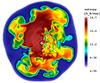
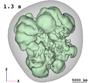
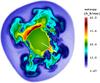
Fig. 2
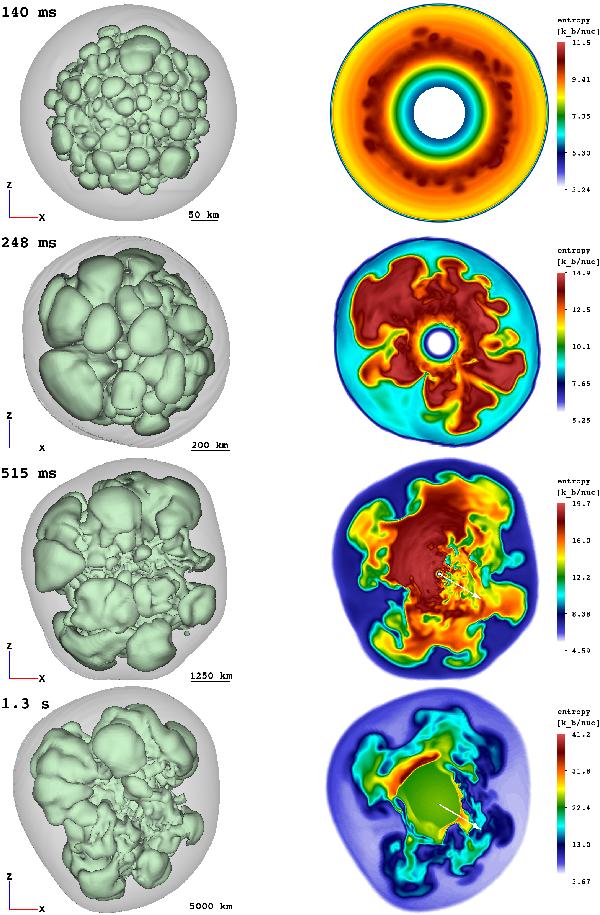
Entropy-isosurfaces (left) of the SN shock (grey) and of the high-entropy bubbles (green), and entropy distribution in a cross-sectional plane (right) at t = 140,248,515 ms, and 1.3 s for model W15-2. The viewing direction is normal to the xz-plane. Length scales are given by the yardsticks below each image. Small Rayleigh-Taylor mushrooms start growing at ~100 ms (top panels). The rising high-entropy bubbles merge and rearrange to form larger bubbles by the time the explosion sets in (second from top). The NS starts accelerating due to the asymmetric distribution of the ejecta, the acceleration reaching its maximum at ~500 ms (third from top). At this epoch, the ejecta show a clear dipolar distribution with more dense, low-entropy material concentrated in the hemisphere containing the kick direction. The final NS kick direction has already found its orientation, and its projection onto the xz-plane is shown by the white arrows pointing to the lower right direction. The bottom panels show the entropy structure when the essentially spherically symmetric neutrino-driven wind has developed, visible as the green central region enclosed by the highly aspherical wind-termination shock (lower right panel).
Current usage metrics show cumulative count of Article Views (full-text article views including HTML views, PDF and ePub downloads, according to the available data) and Abstracts Views on Vision4Press platform.
Data correspond to usage on the plateform after 2015. The current usage metrics is available 48-96 hours after online publication and is updated daily on week days.
Initial download of the metrics may take a while.