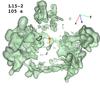
Fig. 15
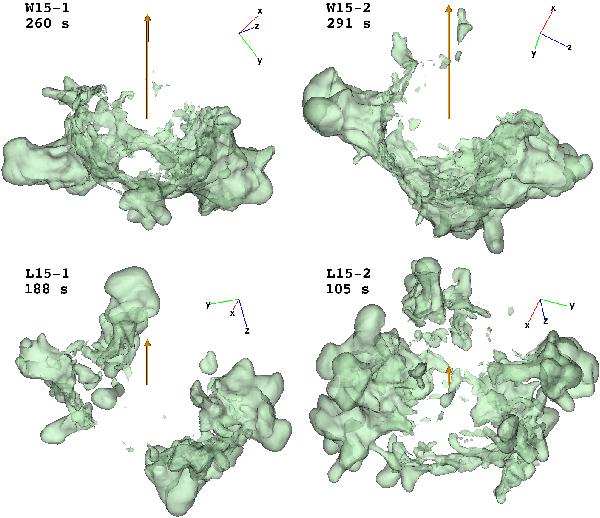
Volumetric three-dimensional visualization of the nickel distribution for models W15-1, W15-2, L15-1, and L15-2 at the postbounce time given in the top left corner of each panel along with the model name. The semi-transparent isosurfaces correspond to a chosen value of the nickel mass per grid cell of 3 × 1026 g and are displayed at a stage well after all nucleosynthesis processes have seized in our simulations. The orange vectors represent the NS kick directions and are scaled by the corresponding NS velocities (96 km s-1 for the shortest arrow and 575 km s-1 for the longest one). The high-kick models W15-1 and W15-2 in the upper two panels exhibit a clear asymmetry with much more nickel being ejected in the hemisphere opposite to the kick direction. In contrast, the moderate-kick models L15-1 and L15-2 in the lower two panels exhibit a more isotropic distribution of the nickel, in particular no obvious hemispheric asymmetry between kick and anti-kick directions. While the radial distribution of the nickel may be strongly affected and changed by subsequent mixing instabilities that develop after the outgoing shock has passed the composition-shell interfaces of the progenitor star, the hemispheric differences in the nickel ejection will not be destroyed during the later supernova explosion.
Current usage metrics show cumulative count of Article Views (full-text article views including HTML views, PDF and ePub downloads, according to the available data) and Abstracts Views on Vision4Press platform.
Data correspond to usage on the plateform after 2015. The current usage metrics is available 48-96 hours after online publication and is updated daily on week days.
Initial download of the metrics may take a while.