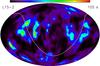
Fig. 14
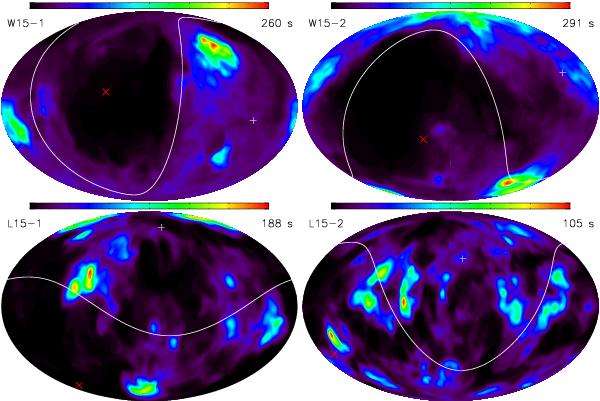
Integrated nickel masses per solid angle in all directions displayed in 4π maps for models W15-1, W15-2, L15-1, and L15-2 at postbounce times well after all nucleosynthesis processes have seized in our simulations. Red crosses indicate the NS kick direction while white plus signs mark the direction opposite to the kick. The corresponding hemispheres are separated by a white equator line. Note the differences between the high-kick W15 models and the moderate-kick L15 models. The former show a clear enhancement of the nickel production in the hemisphere opposite to the kick, whereas the latter eject nickel significantly more isotropically.
Current usage metrics show cumulative count of Article Views (full-text article views including HTML views, PDF and ePub downloads, according to the available data) and Abstracts Views on Vision4Press platform.
Data correspond to usage on the plateform after 2015. The current usage metrics is available 48-96 hours after online publication and is updated daily on week days.
Initial download of the metrics may take a while.