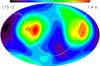
Fig. 13
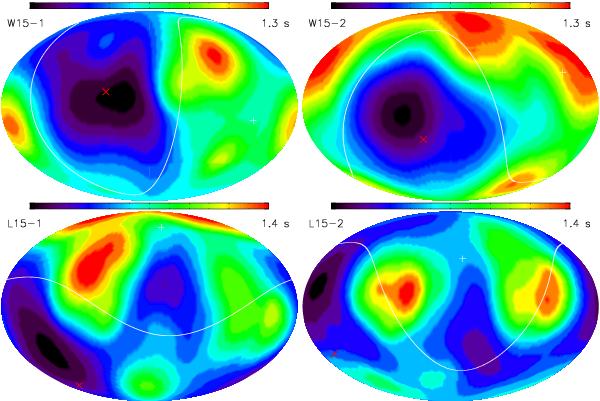
Shock deformation for the high-kick models W15-1 and W15-2 and for the moderate-kick models L15-1 and L15-2 at 1.3 s or 1.4 s after bounce, as given in the upper right corner of each map. These times are close to the evolution phases when the nickel production in the shock-heated ejecta takes place. The color scale is linear with black indicating minima and red maxima. The differences between maxima and minima relative to the average shock radii are 30%, 35%, 34%, and 29%, respectively. Red crosses indicate the NS kick directions while white plus signs mark the directions opposite to the kicks. The white lines separate the corresponding two hemispheres. The northern hemisphere is defined as centered around the NS kick vector.
Current usage metrics show cumulative count of Article Views (full-text article views including HTML views, PDF and ePub downloads, according to the available data) and Abstracts Views on Vision4Press platform.
Data correspond to usage on the plateform after 2015. The current usage metrics is available 48-96 hours after online publication and is updated daily on week days.
Initial download of the metrics may take a while.