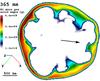
Fig. 12
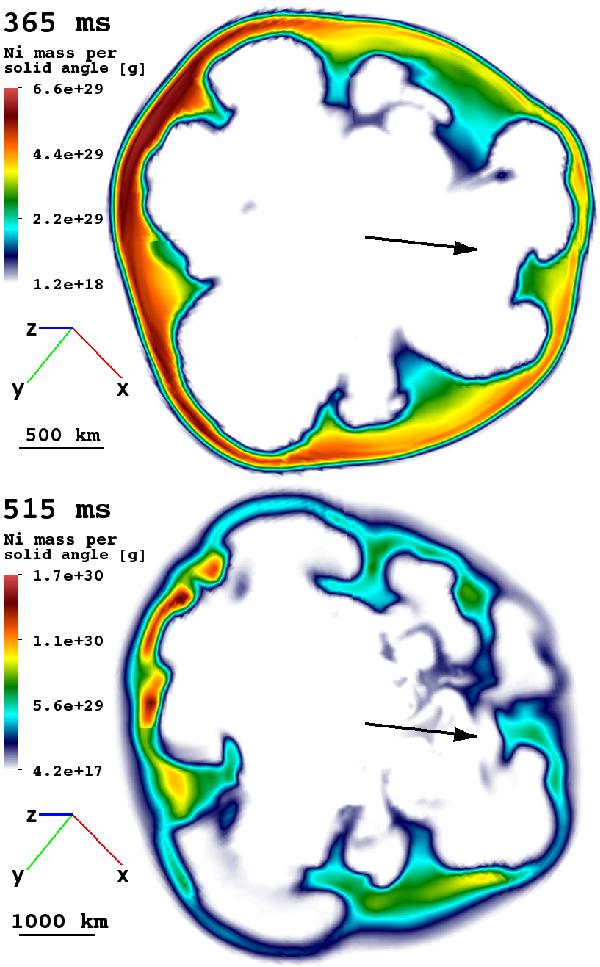
56Ni distribution for model W15-2 at 365 ms and 515 ms after bounce as produced by explosive burning in shock-heated ejecta. The integrated nickel mass per solid angle is plotted in the cross-sectional plane that contains the NS kick (indicated by the black arrows pointing to the right) and spin vectors. Red colored regions show that more nickel is formed in the direction opposite to the NS kick direction. The size of the displayed volume can be estimated from the yardsticks given in the lower left corner of each image.
Current usage metrics show cumulative count of Article Views (full-text article views including HTML views, PDF and ePub downloads, according to the available data) and Abstracts Views on Vision4Press platform.
Data correspond to usage on the plateform after 2015. The current usage metrics is available 48-96 hours after online publication and is updated daily on week days.
Initial download of the metrics may take a while.