Fig. 7
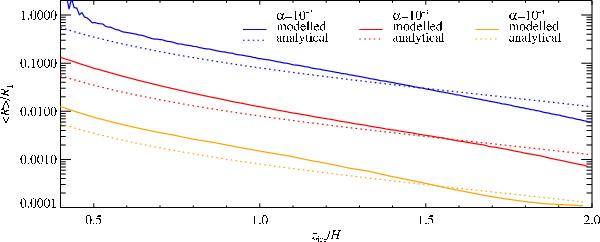
Mean ice particle size as a function of the position of the atmospheric ice line and the strength of the turbulence. The mean particle size ⟨ R ⟩ is shown as a function of the distance from the atmospheric ice line to the midplane zice, in gas scale heights H. The system is shown when the particle sizes have approximately reached an equilibrium, at t = 5000 Ω-1 for α = 10-2, shown in blue, at t = 25 000 Ω-1 for α = 10-3, shown in red, and at t = 100 000 Ω-1 for α = 10-4, shown in yellow. The initial particle size is 10-4 R1, corresponding to approximately 0.1mm at the ice line. Solid lines are modelled values and dotted lines are analytical values, set by Eq. (53). The modelled and analytical values follow the same slope in the applicable range.
Current usage metrics show cumulative count of Article Views (full-text article views including HTML views, PDF and ePub downloads, according to the available data) and Abstracts Views on Vision4Press platform.
Data correspond to usage on the plateform after 2015. The current usage metrics is available 48-96 hours after online publication and is updated daily on week days.
Initial download of the metrics may take a while.