Fig. 6
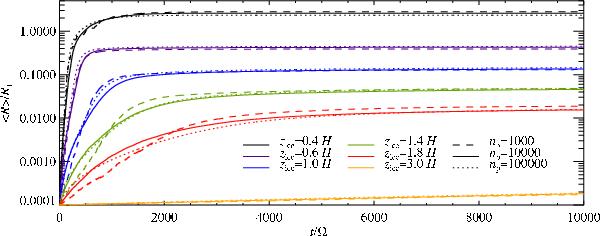
Mean ice particle size as a function of time for different positions of the atmospheric ice line. The different lines show the growth for different distances from the atmospheric ice line to the midplane, zice. From top to bottom zice = 0.4 H, 0.6 H, 1.0 H, 1.4 H,1.8 H and 3.0 H. Ice particles grow faster, and to larger sizes, the closer to the midplane the atmospheric ice line is. Full lines denote simulations with 10 000 particles, dashed lines 1000 particles and dotted lines 100 000 particles.
Current usage metrics show cumulative count of Article Views (full-text article views including HTML views, PDF and ePub downloads, according to the available data) and Abstracts Views on Vision4Press platform.
Data correspond to usage on the plateform after 2015. The current usage metrics is available 48-96 hours after online publication and is updated daily on week days.
Initial download of the metrics may take a while.