Fig. 5
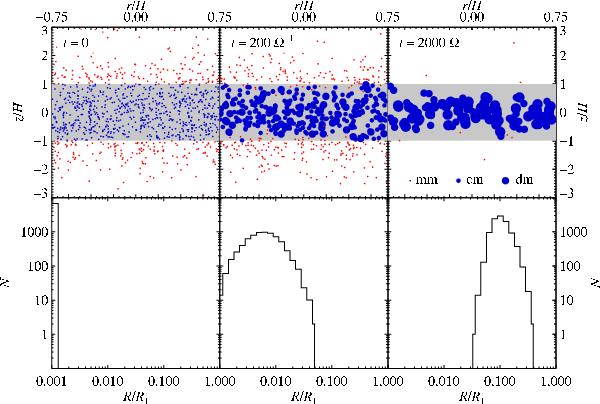
State of simulation with only the atmospheric ice line included, for t = 0, 200 Ω and 2000 Ω-1, from left to right. Upper panels: distribution of blue ice particles and red vapour particles, with the grey area representing the condensation zone. The size of the blue dots are proportional to the size of the ice particles and the number of particles shown is inversely scaled with size for visibility. Lower panels: evolution of the size distribution of ice particles at corresponding times. N is the number of ice superparticles, and the size is given as R/R1. At the water ice line, R1 ≈ 1.3 m.
Current usage metrics show cumulative count of Article Views (full-text article views including HTML views, PDF and ePub downloads, according to the available data) and Abstracts Views on Vision4Press platform.
Data correspond to usage on the plateform after 2015. The current usage metrics is available 48-96 hours after online publication and is updated daily on week days.
Initial download of the metrics may take a while.