Fig. 3
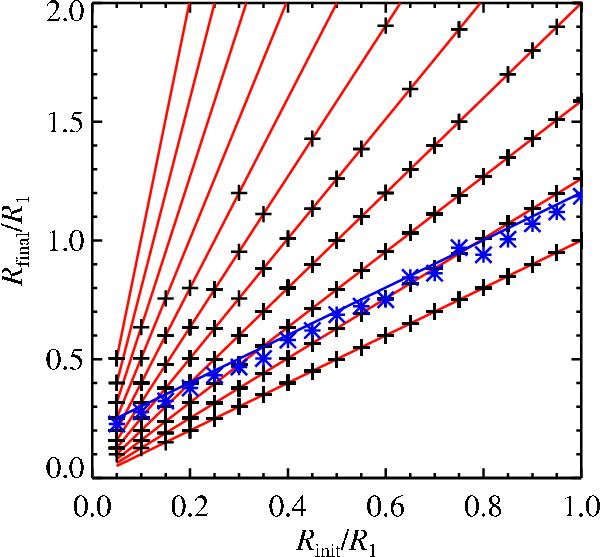
Comparison between average modelled growth and analytically expected growth of ice particles. The final particle size as a function of initial particle size is shown for 2000 ice superparticles distributed evenly in 20 different initial size bins over the range R/R1 = [0,1] , and with 20 000 vapour superparticles added. Black crosses show modelled values and blue stars show the average growth in each size bin. The modelled average size roughly agrees with the analytical value, shown as a blue line. Red lines denote expected size for a number of condensation events between 0 (lower line) and 10 (upper line).
Current usage metrics show cumulative count of Article Views (full-text article views including HTML views, PDF and ePub downloads, according to the available data) and Abstracts Views on Vision4Press platform.
Data correspond to usage on the plateform after 2015. The current usage metrics is available 48-96 hours after online publication and is updated daily on week days.
Initial download of the metrics may take a while.