Fig. 2
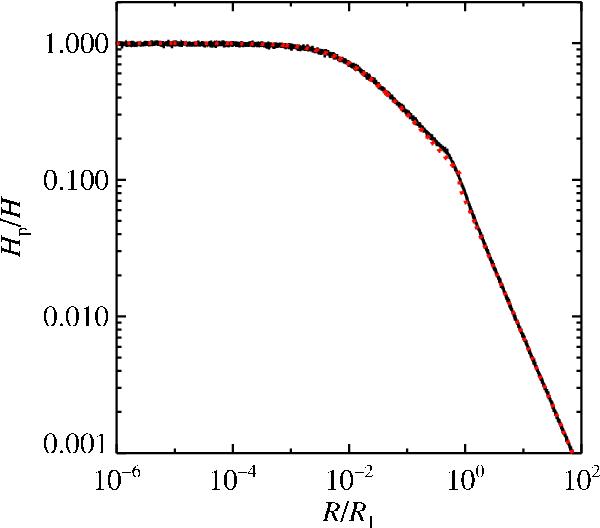
Comparison between modelled and analytical particle scale height as a function of particle size, for a turbulence strength of α = 10-2. The black full line denotes modelled values and the red dotted line analytical values. Small particles R ≲ 10-3 are perfectly coupled to the gas, whereas larger particles sediment towards the midplane. The slope change at R ≈ 0.5 is caused by the change from Epstein to Stokes drag regime. The particle size is given in units of R1, where R1 ≈ 1 m at r = 3 AU. Overall, modelled and analytical values are in good agreement.
Current usage metrics show cumulative count of Article Views (full-text article views including HTML views, PDF and ePub downloads, according to the available data) and Abstracts Views on Vision4Press platform.
Data correspond to usage on the plateform after 2015. The current usage metrics is available 48-96 hours after online publication and is updated daily on week days.
Initial download of the metrics may take a while.