Fig. 10
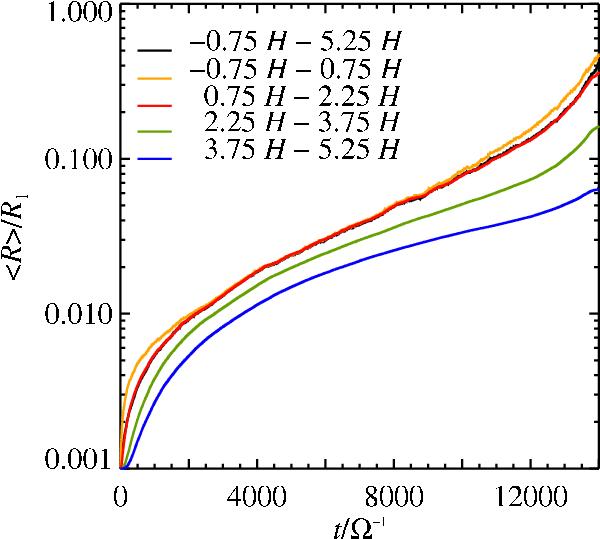
Growth in different radial subdomains of the simulation box shown in Fig. 9. Black shows the average particle size in the total box, whereas yellow, red, green and blue give the average particle sizes in the different subdomains, from left to right. The total particle size at any time is dominated by the growth near the radial ice line.
Current usage metrics show cumulative count of Article Views (full-text article views including HTML views, PDF and ePub downloads, according to the available data) and Abstracts Views on Vision4Press platform.
Data correspond to usage on the plateform after 2015. The current usage metrics is available 48-96 hours after online publication and is updated daily on week days.
Initial download of the metrics may take a while.