Free Access
Fig. 6
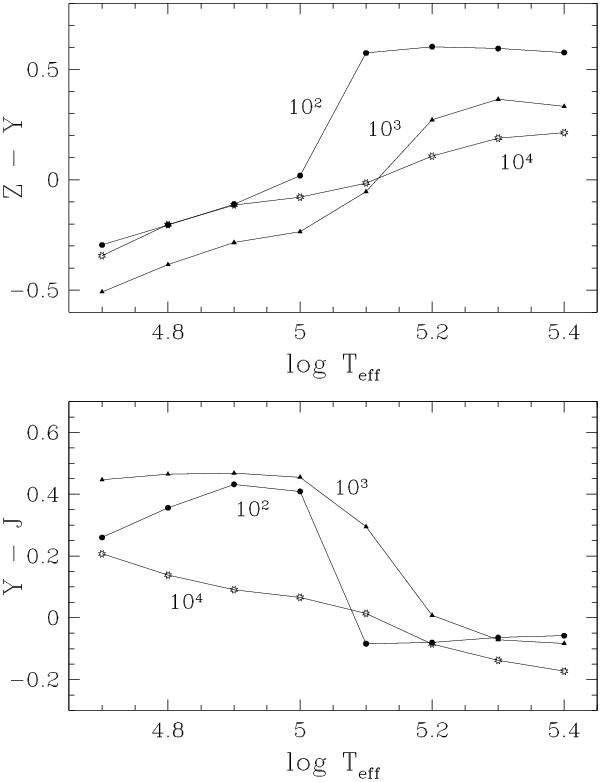
Distribution of the colour indices (Y − J) and (Z − Y) as function of stellar temperature, for the Cloudy model grid described in the paper. Each curve is for a fixed density, indicated by the adjacent label.
Current usage metrics show cumulative count of Article Views (full-text article views including HTML views, PDF and ePub downloads, according to the available data) and Abstracts Views on Vision4Press platform.
Data correspond to usage on the plateform after 2015. The current usage metrics is available 48-96 hours after online publication and is updated daily on week days.
Initial download of the metrics may take a while.