Fig. 4
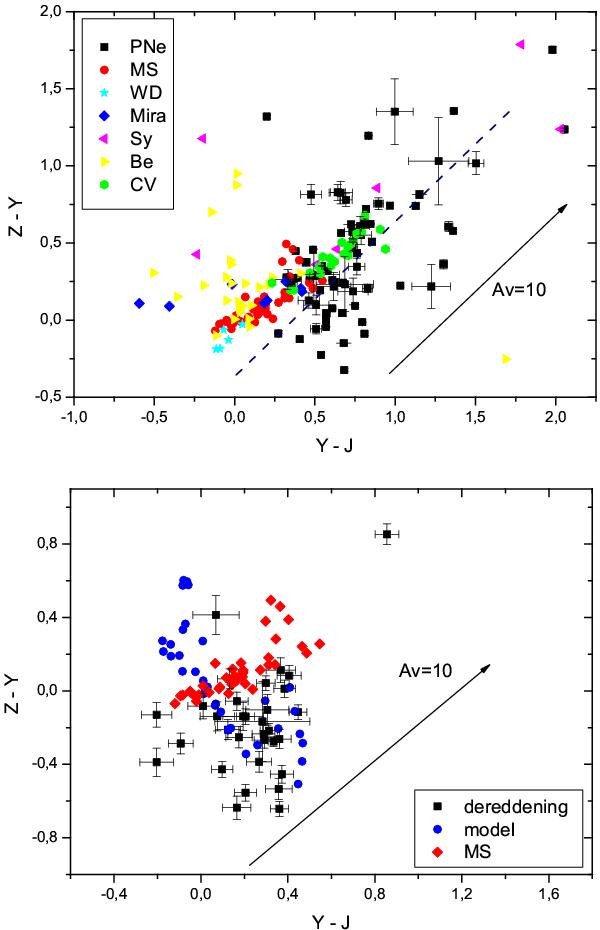
Distribution of the colour indices (Y − J) and (Z − Y). The upper panel show all detected PNe without applying any extinction correction. Other symbols show other emission-line stars, main sequence stars (Hewett et al. 2006) and white dwarfs (taken from the standard database of MKO) as indicated. The bottom panel shows dereddened colours for the PNe, using the reddening measured from the hydrogen lines. The distribution of the colour indices (Y − J) and (Z − Y) for a model grid of planetary nebulae is shown in blue.
Current usage metrics show cumulative count of Article Views (full-text article views including HTML views, PDF and ePub downloads, according to the available data) and Abstracts Views on Vision4Press platform.
Data correspond to usage on the plateform after 2015. The current usage metrics is available 48-96 hours after online publication and is updated daily on week days.
Initial download of the metrics may take a while.