Fig. 3
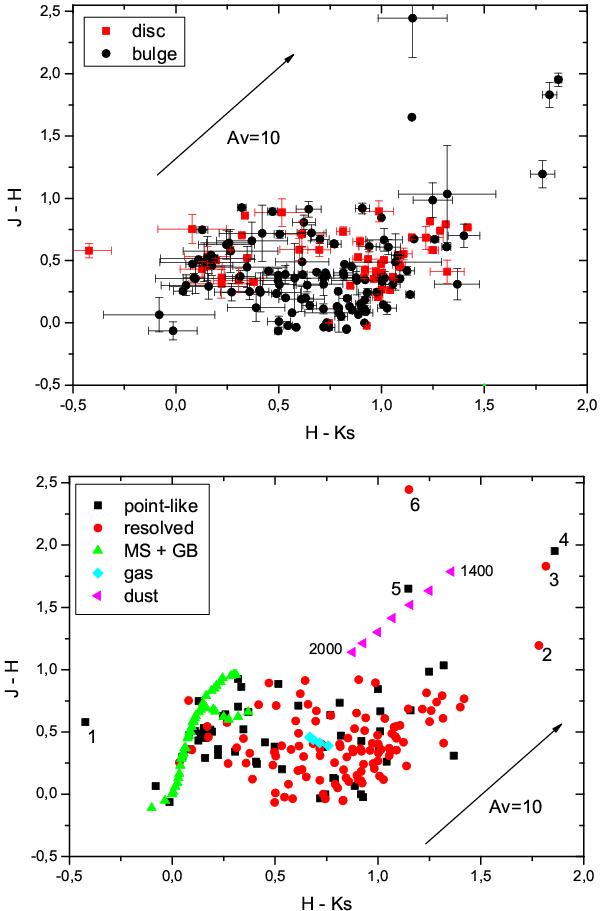
Upper panel: distribution of PNe according to whether they belong to the plane or bulge. Lower panel: distribution of colour indices (H − Ks) and (J − H) for the PNe analysed as “galaxy-like” (resolved) by the pipeline, plotted as red circles, point-like sources, plotted as black squares; error bars have been left our for the sake for clarity. The magenta triangles indicate dust emission loci for an emissivity exponent γ = 0 and temperature  K (in steps of 100 K, Phillips & Cuesta 1994). Intrinsic stellar indices for MS spectral types (Bessell & Brett 1988) and the O-type from Martins et al. (2005) are shown by green triangles. Finally, the free-free and free-bound emission from hydrogen ions are shown for the range of 8400 to 17 000 K, by the cyan diamond symbols.
Current usage metrics show cumulative count of Article Views (full-text article views including HTML views, PDF and ePub downloads, according to the available data) and Abstracts Views on Vision4Press platform.
Data correspond to usage on the plateform after 2015. The current usage metrics is available 48-96 hours after online publication and is updated daily on week days.
Initial download of the metrics may take a while.