Fig. 7
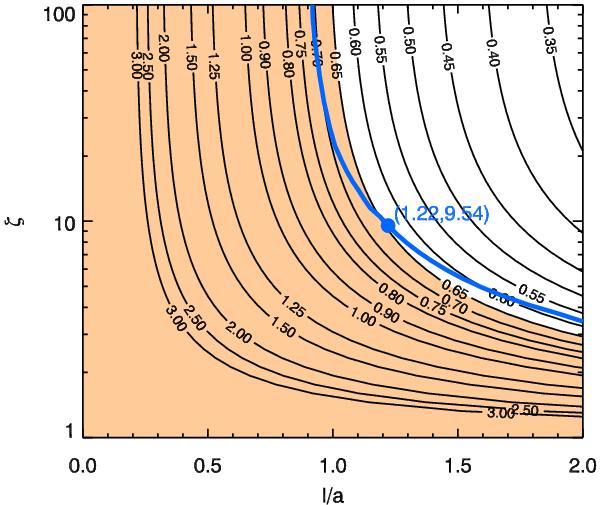
The allowed range of ℓ/a and ζ for a range of values of (τ/P)min as derived using Eq. (15). The ranges exist to the left of each curve as illustrated with the shaded area for (τ/P)min = 0.65. The thick curve represents the value of ζmax as a function of (ℓ/a)max that fits best the observed quality factor distribution. A uniform distribution in ζ has been assumed. The use of a Jeffrey’s distribution instead would yield an almost identical curve. The dot indicates the values of (ℓ/a)max and ζmax for the fit with the smallest χ2.
Current usage metrics show cumulative count of Article Views (full-text article views including HTML views, PDF and ePub downloads, according to the available data) and Abstracts Views on Vision4Press platform.
Data correspond to usage on the plateform after 2015. The current usage metrics is available 48-96 hours after online publication and is updated daily on week days.
Initial download of the metrics may take a while.