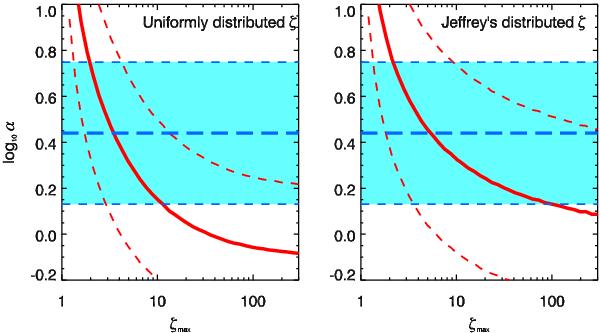
Fig. 4

The mean parameter log 10α as a function of ζmax with ζmin = 1 obtained from N fits to a forward modelled sample of values of periods and damping times, using the uniform distribution for ℓ/a given in Eq. (4) and a uniform (left) and a Jeffrey’s (right) distributions for ζ as given in Eqs. (4) and (6), respectively. The dashed curves bound the one-σ variation in log 10α. The horizontal long-dashed line shows the observed value of log 10α bounded by its one-σ variation.
Current usage metrics show cumulative count of Article Views (full-text article views including HTML views, PDF and ePub downloads, according to the available data) and Abstracts Views on Vision4Press platform.
Data correspond to usage on the plateform after 2015. The current usage metrics is available 48-96 hours after online publication and is updated daily on week days.
Initial download of the metrics may take a while.


