Fig. 3
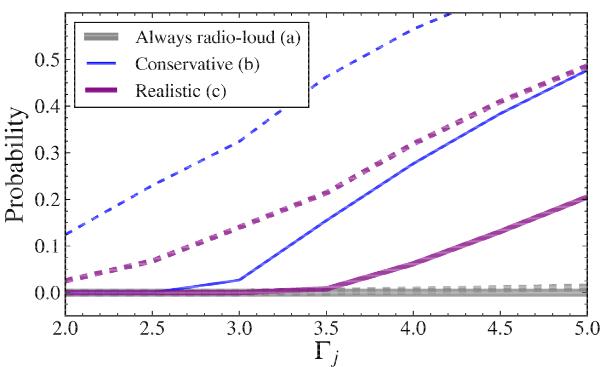
Probability of our data (i.e., no flux above the two times the image rms) for the three scenarios of the internal model (Eq. (3)). The solid lines show P7 the probability that all seven TDFs we observed indeed hosted a jet; the dashed lines show P≥ 1 the probability that at least one flare hosted a jet. For Γj < 3 the former hypothesis is ruled out at 95% confidence for all scenarios.
Current usage metrics show cumulative count of Article Views (full-text article views including HTML views, PDF and ePub downloads, according to the available data) and Abstracts Views on Vision4Press platform.
Data correspond to usage on the plateform after 2015. The current usage metrics is available 48-96 hours after online publication and is updated daily on week days.
Initial download of the metrics may take a while.