Free Access
Fig. 7
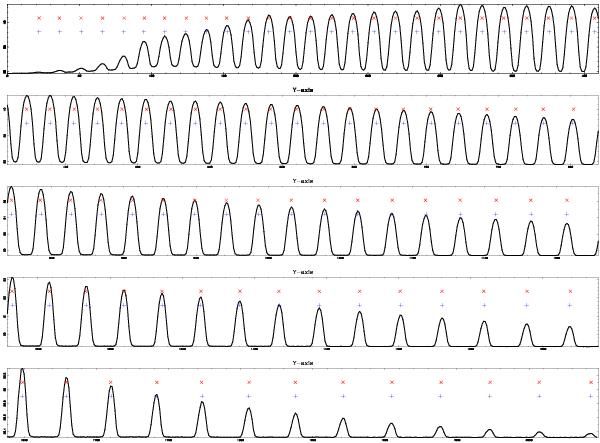
Vertical section of a continuum exposure at the central X-axis pixel, showing the projection on the CCD of each order, from red wavelengths (top-left) to blue ones (bottom-right). The location of the peak intensity of each order is marked with a red (central pixel) and a blue cross (centroid).
Current usage metrics show cumulative count of Article Views (full-text article views including HTML views, PDF and ePub downloads, according to the available data) and Abstracts Views on Vision4Press platform.
Data correspond to usage on the plateform after 2015. The current usage metrics is available 48-96 hours after online publication and is updated daily on week days.
Initial download of the metrics may take a while.