Free Access
Fig. 15
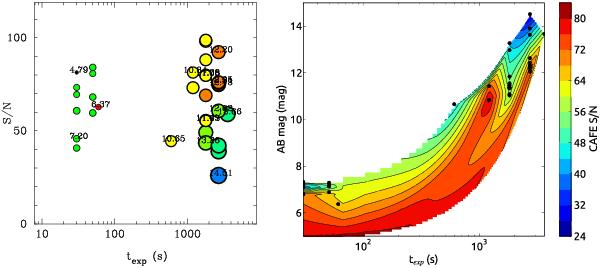
CAFE: results from the S/N analysis. The left panel shows the distribution of the S/N during the exposure time for the different observed objects. The color/size of the plotted symbols indicates the brightness of the object. The right panel shows the S/N distribution as a function of the brightness and the exposure time.
This figure is made of several images, please see below:
Current usage metrics show cumulative count of Article Views (full-text article views including HTML views, PDF and ePub downloads, according to the available data) and Abstracts Views on Vision4Press platform.
Data correspond to usage on the plateform after 2015. The current usage metrics is available 48-96 hours after online publication and is updated daily on week days.
Initial download of the metrics may take a while.