Fig. 14
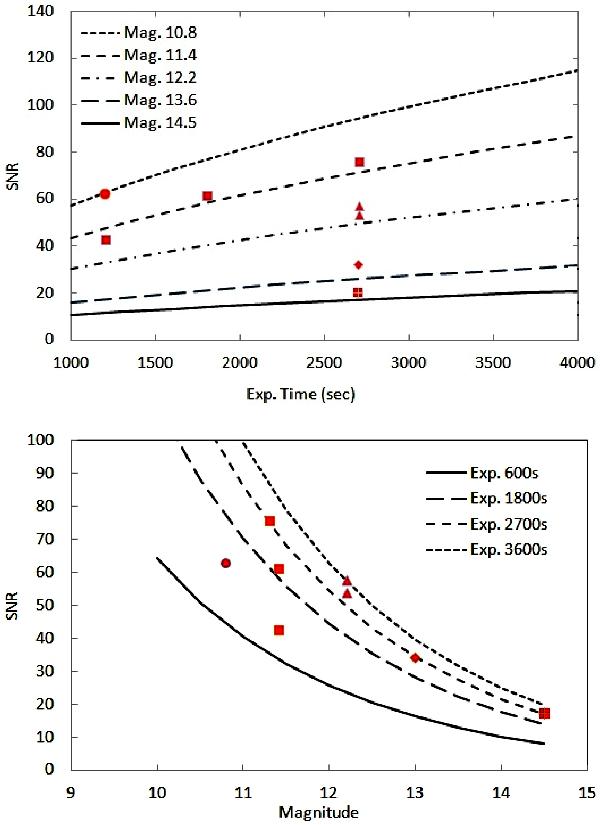
Upper panel: the S/N as a function of time for a given magnitude. Some experimental data for the corresponding magnitude are plotted on the theoretical curves for which magnitudes were derived. Lower panel: the S/N is shown as a fucntion of magnitude for different fixed exposure times. The same experimental data as in the upper case were plotted to be consistent.
Current usage metrics show cumulative count of Article Views (full-text article views including HTML views, PDF and ePub downloads, according to the available data) and Abstracts Views on Vision4Press platform.
Data correspond to usage on the plateform after 2015. The current usage metrics is available 48-96 hours after online publication and is updated daily on week days.
Initial download of the metrics may take a while.