Free Access
Fig. 11
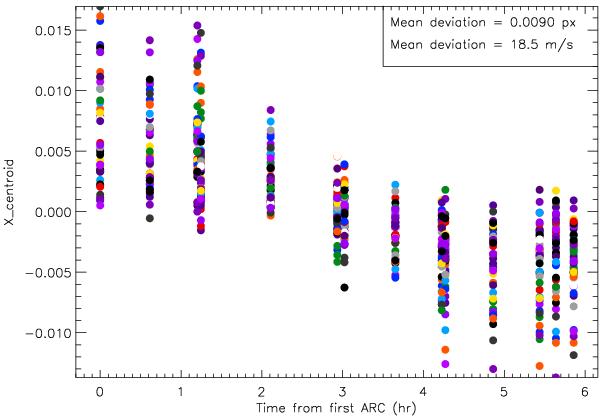
Stability of CAFE along a six-hours observing night on June 23, 2012. The mean dispersion of the centroid position in the X-axis for the different Th-Ar frames is shown. Forty-three spots, represented with different colors, were used in 14 ThAr arc images to generate this figure.
Current usage metrics show cumulative count of Article Views (full-text article views including HTML views, PDF and ePub downloads, according to the available data) and Abstracts Views on Vision4Press platform.
Data correspond to usage on the plateform after 2015. The current usage metrics is available 48-96 hours after online publication and is updated daily on week days.
Initial download of the metrics may take a while.