Fig. 9
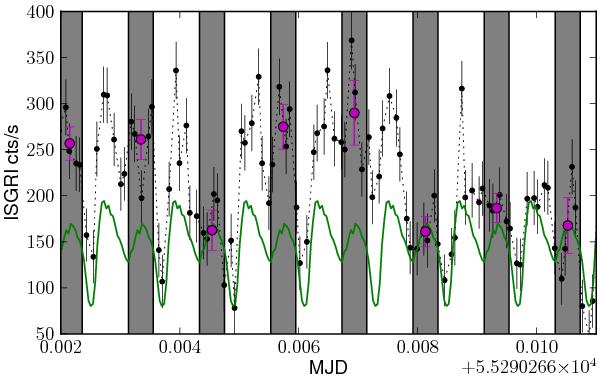
20–120 keV ISGRI light curve of the INTEGRAL observation during rev. 0912 (black data points) together with the overplotted repeated averaged pulse profile (solid curve). The selected pulse-phase interval is indicated by shaded areas. The pulse-to-pulse variability can clearly be seen. The measured amplitudes of individual pulses (see text) are shown with magenta circles.
Current usage metrics show cumulative count of Article Views (full-text article views including HTML views, PDF and ePub downloads, according to the available data) and Abstracts Views on Vision4Press platform.
Data correspond to usage on the plateform after 2015. The current usage metrics is available 48-96 hours after online publication and is updated daily on week days.
Initial download of the metrics may take a while.