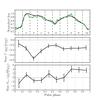
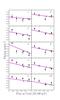
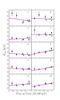
Fig. 6

Best-fit parameters of the pulse-phase resolved spectra at different flux levels with 1σ errors. Left column: in the top panel, the averaged and normalized pulse profile of the INTEGRAL observation during rev. 0912 (3–80 keV, black line) and the RXTE observation 95347-02-01-01 (3−60 keV, green line) are shown. The pulse-phase intervals for which the spectra were extracted are indicated by vertical dashed lines and numbered from “1” to “10”. Within each bin, we analyzed the spectral parameters as a function of flux. The middle and bottom panels represent the slopes with associated 1σ-uncertainties obtained from the linear fits to the Γ-flux and Ecyc-flux dependencies in each pulse-phase bin which are shown in the middle and right columns. Middle and right columns: the photon index Γ and the cyclotron line energy Ecyc as a function of the 10–100 keV flux for each of the ten phase intervals marked by the numbers. The solid lines show the linear fits to the data points. The RXTE observations are marked with triangles, while the INTEGRAL observations – with circles.
Current usage metrics show cumulative count of Article Views (full-text article views including HTML views, PDF and ePub downloads, according to the available data) and Abstracts Views on Vision4Press platform.
Data correspond to usage on the plateform after 2015. The current usage metrics is available 48-96 hours after online publication and is updated daily on week days.
Initial download of the metrics may take a while.