Fig. 8
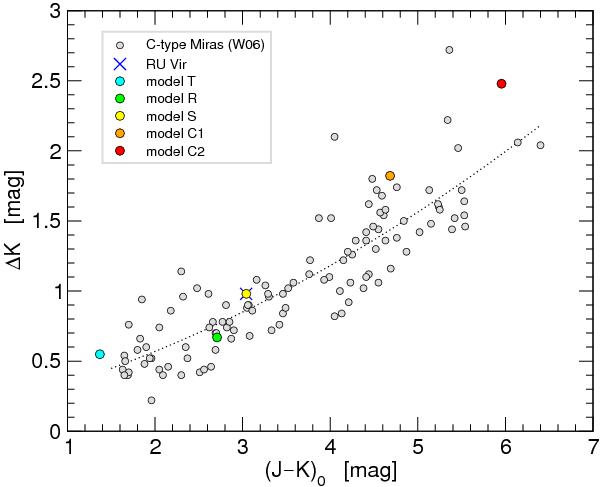
Amplitudes of the K-band photometric variations of the C-type Miras listed in Table 3 of Whitelock et al. (2006) plotted against the corresponding mean colour indices which are corrected for interstellar reddening and given in Table 6 of Whitelock et al. (2006). The dotted line was fitted to guide the eye. Overplotted are the values resulting from the different atmospheric models. Note, that model S exactly reproduces the data of RU Vir which is, therefore, plotted with a different symbol than in other figures.
Current usage metrics show cumulative count of Article Views (full-text article views including HTML views, PDF and ePub downloads, according to the available data) and Abstracts Views on Vision4Press platform.
Data correspond to usage on the plateform after 2015. The current usage metrics is available 48-96 hours after online publication and is updated daily on week days.
Initial download of the metrics may take a while.