Free Access
Fig. 6
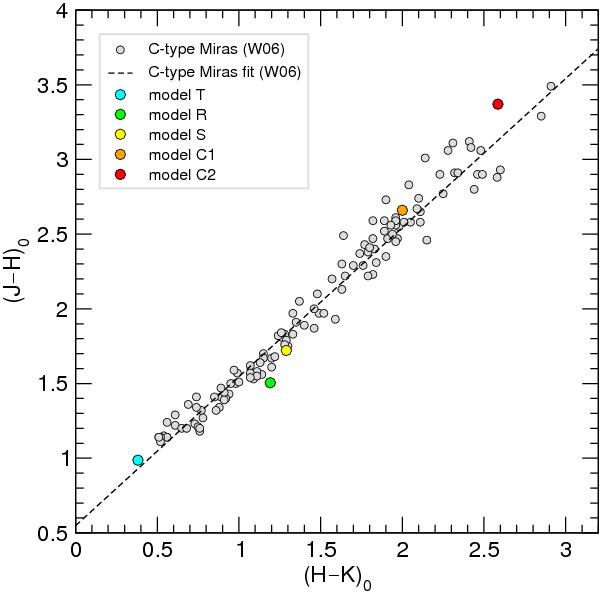
Mean colours corrected for interstellar reddening as listed in Table 6 of Whitelock et al. (2006) for all C-type Miras. The dashed line represents the fit given in Eq. (2) of Whitelock et al. (2006) for the de-reddened Mira sample. Overplotted are the synthetic mean colours of all dynamical models for comparison.
Current usage metrics show cumulative count of Article Views (full-text article views including HTML views, PDF and ePub downloads, according to the available data) and Abstracts Views on Vision4Press platform.
Data correspond to usage on the plateform after 2015. The current usage metrics is available 48-96 hours after online publication and is updated daily on week days.
Initial download of the metrics may take a while.