Fig. 3
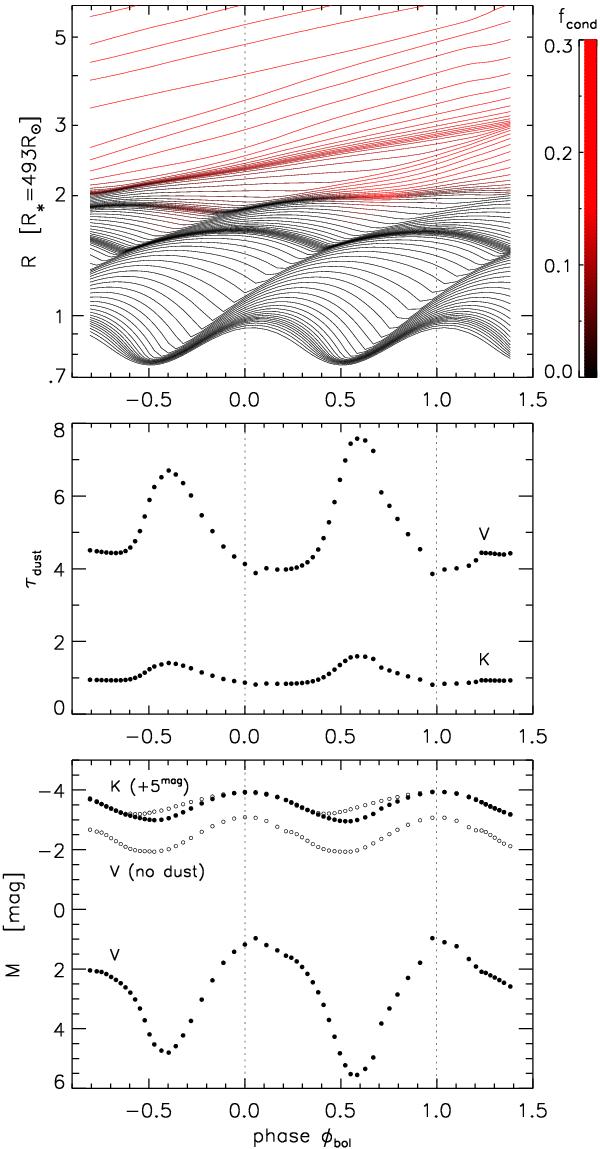
Illustration of the effect of dust formation on the photometric appearance of the star, demonstrated with the help of model S. Upper panel: movement of atmospheric layers of the model over about two light cycles, colour-coded is the degree of condensation of carbon into dust grains. Middle panel: optical depths of the dust envelope as a function of time, calculated for the central wavelengths of the filters V and K following Eq. (1). Lower panel: resulting synthetic lightcurves for the same filters (filled circles), together with the corresponding photometry for which the dust opacities were not included (open circles). Note that the K-lightcurves were shifted by 5mag to fit into the panel (cf. Fig. 7 in Paper II).
Current usage metrics show cumulative count of Article Views (full-text article views including HTML views, PDF and ePub downloads, according to the available data) and Abstracts Views on Vision4Press platform.
Data correspond to usage on the plateform after 2015. The current usage metrics is available 48-96 hours after online publication and is updated daily on week days.
Initial download of the metrics may take a while.