Fig. B.2
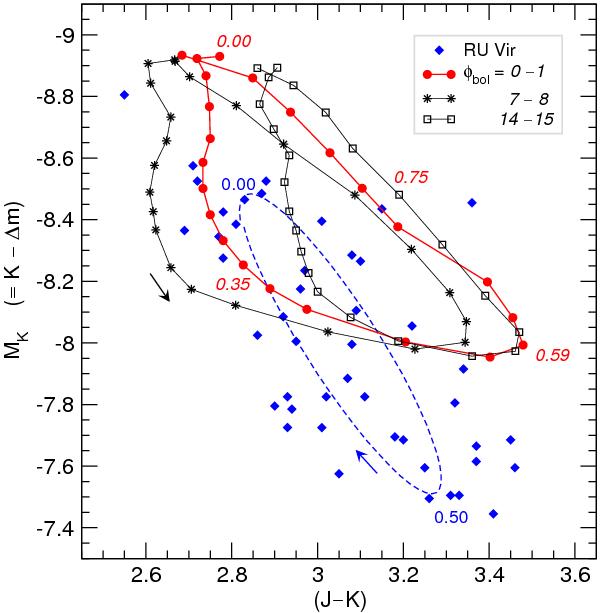
Colour–magnitude diagram containing individual observations of RU Vir adopted from Table 2 of Whitelock et al. (2006) and shifted to an absolute scale MK by applying the distance modulus derived by the same authors (cf. their Table 6). The dashed line marks the average variation of RU Vir during the light cycle as derived from the Fourier fits in Fig. 8 of Paper II. Overplotted are the corresponding synthetic photometric data of model S. Three different pulsation cycles are plotted with the same symbols, colour-coding, and labels as in Fig. 13 of Paper II. The arrows mark the directions of how the objects pass through the loops during a light cycle, selected phases are labelled (convention for φbol / φv as in Paper II).
Current usage metrics show cumulative count of Article Views (full-text article views including HTML views, PDF and ePub downloads, according to the available data) and Abstracts Views on Vision4Press platform.
Data correspond to usage on the plateform after 2015. The current usage metrics is available 48-96 hours after online publication and is updated daily on week days.
Initial download of the metrics may take a while.